Energized + Planned Map
Published on Nov 16, 2025 by Derek Eder
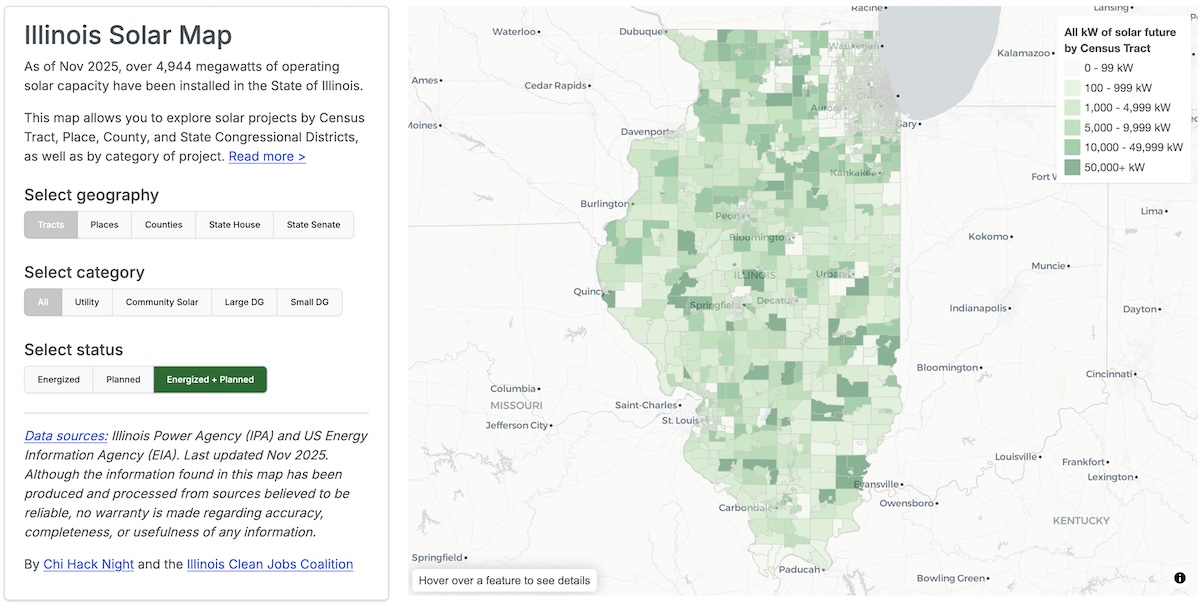
By request from our friends at the IL Clean Jobs Coalition, we have added a new view to the Illinois Solar Map. You can now see both Energized and Planned solar projects in the same map, giving you a view into what solar energy production will look like 4-5 years from now.
While the calculation is relatively simple (we’re just adding energized and planned together), the visual it creates is a powerful one: showing where 10 gigawatts of solar are deployed across Illinois by 2029.
This future view will continue to be updated as we update our data and more solar projects are built and planned.