About Illinois Solar Map
With the passage of the Climate and Equitable Jobs Act (CEJA) in 2021, Illinois is on a path to 100% carbon-free energy by 2050 and has enabled the rapid expansion of clean energy installations. This map is a first pass at creating a statewide aggregate tracking the status of the state’s rapid expansion of solar projects.
As of May 2026, over 6,557 megawatts of operating solar capacity have been installed in the State of Illinois, with 5,259 megawatts planned or under construction. For comparison, Prairie State, the State’s largest coal power plant, is 1,630 megawatts, illustrating just how far we've come in a few years, but still how far we have to go to reach 100% renewable energy in Illinois.
There are 103,715 solar projects throughout the state, ranging in size from a single 0.6 kW solar panel to the 200 megawatt Prairie Wolf Solar project in Coles County.
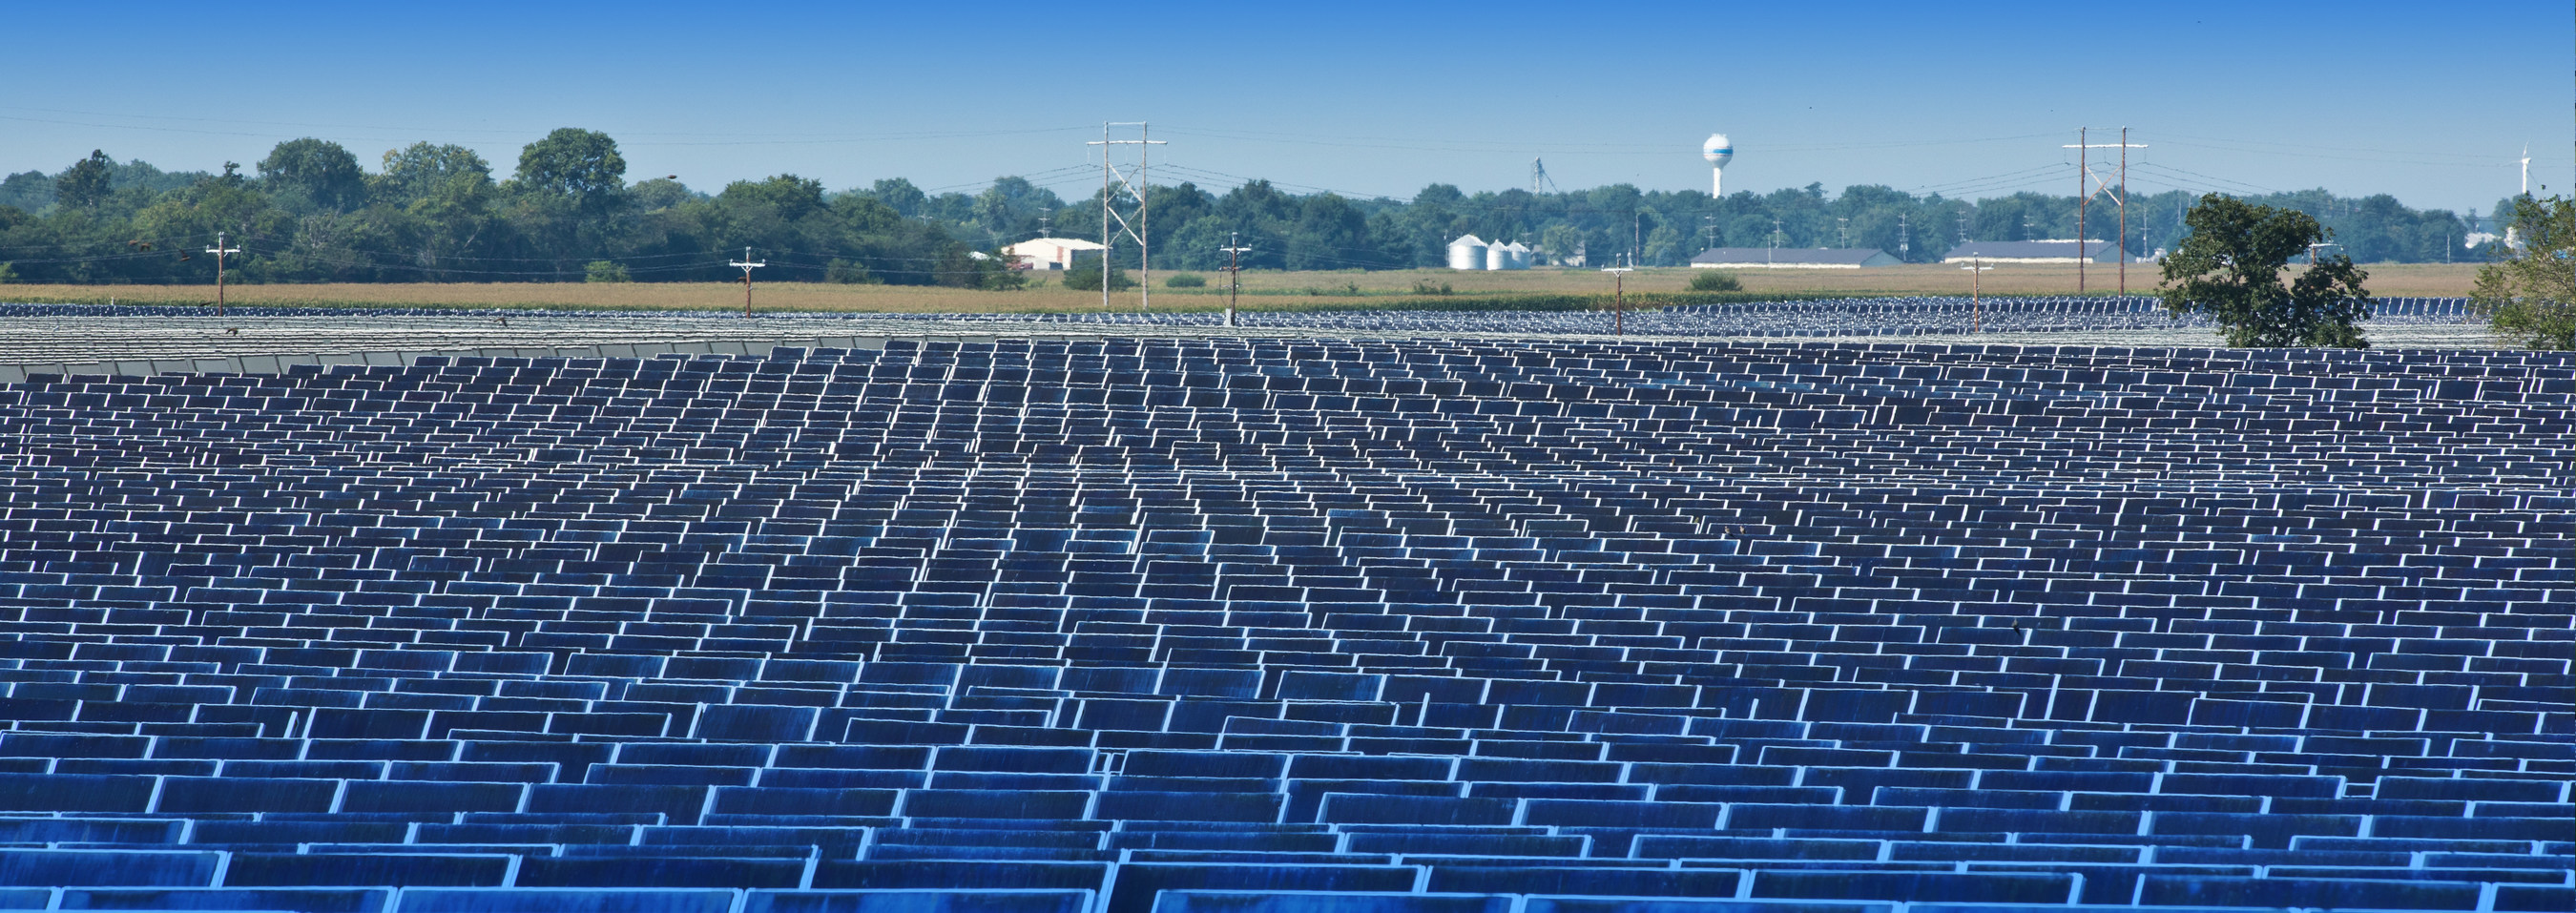
The Prarie Wolf Solar Project in Coles County
Table of contents
- Categories of solar projects
- Projects by category
- Solar installations over time
- Planned projects
- Data sources
- Missing data
- Team and collaborators
Categories of solar projects
All units of power measurement are in megawatts (MW), specifically alternating current (MWAC).
Solar installations are divided up into 4 categories:
- Utility: Utility Scale Solar projects built by energy utilities
- Community Solar (CS): Community Solar projects whose electricity is shared by more than a single property
- Large Distributed Generation (Large DG): Large Distributed Generation (DG) systems above 25 kW up to 2,000 kW in size
- Small Distributed Generation (Small DG): Small Distributed Generation (DG) for systems 25 kW and below
Energized projects by category
Solar installations over time
Our data covers utility solar projects starting in December 2009. Data from the Adjustable Block Program and Illinois Solar for All start in 2019.
Planned projects are based on scheduled energization dates, which can be delayed. All planned projects have recieved official approval and, based on our research, have a >95% chance of being built.
Description: Area chart showing the cumulative megawatts of Utility, Small Distributed Generation, Large Distributed Generation and Community solar energized and planned in Illinois. There is a notable increase in megawatts installed starting in late 2019.
Planned projects
An additional 5,259 megawatts of solar is planned or under construction in Illinois, over double what is currently energized.
** Note: our source data does not show planned community solar projects. They are likely grouped with Large DG.
You can view where and what kind of projects are planned by clicking the 'Planned' selector on the map:

Energized (blue) vs Planned (purple) kW of solar in Illinois
Data sources
The raw data for this map is available to view and download here. The code for this website and to categorize and aggregate the project data by category and geography are open source at github.com/chihacknight/il-solar-map.
Solar project sources
- Illinois Adjustable Block Program Project Applications published by the Illinois Power Agency (IPA) (May 2019 - May 2026)
- Illinois Solar for All Projects administered by Elevate and IPA (May 2019 - May 2026)
- Utility solar projects (US EIA-860M) (Dec 2009 - April 2026)
Boundary sources
- Illinois Counties
- Illinois State Senate Districts (2023)
- Illinois State House Districts (2023)
- Illinois Census Tracts (2020)
Legislator info
Missing data
This map does not represent every single solar project in Illinois. Our data does not include:
- solar project that came online after May 2026
- small-scale solar projects that were funded before Future Energy Jobs Act (FEJA) programs were implemented (before 2018)
- solar projects that did not get funding from the Adjustable Block or Illinois Solar for All programs
Team and collaborators
This map and the data were created in collaboration with the Illinois Clean Jobs Coalition Renewables Subcommittee and civic tech volunteers at Chi Hack Night.
- Derek Eder - Project and development lead
- Surag Nuthulapaty - Data aggregation
- Forest Gregg - Data aggregation
- Eric Sherman - Mapping and consulting
Questions? Email Derek at derek@derekeder.com
Check out some of the other climate related projects from Chi Hack Night: Decarb My State and Electrify Chicago