Data update, hotlinks, and new map buckets
Published on May 08, 2025 by Derek Eder
As of May 8, 2025, an additional 327 megawatts (MW) of solar have been energized in the State of Illinois, bringing the total to 4,648 MW. 83,542 solar projects have been energized in our state.
Additionally, 1,515 MW of planned solar projects have been added since our update last month. The majority of this increase (1,420 MW) is in the planned Large Distributed Generation (Large DG) category. Projects appear to be spread throughout the entire state.
| Category | Apr 11, 2025 | May 8, 2025 | Change |
|---|---|---|---|
| Energized | 4,321 MW | 4,648 MW | +327 MW |
| Planned | 4,610 MW | 6,125 MW | +1,515 MW |
Data from our 3 primary sources are updated at different intervals, so the above data is valid as of the following the dates:
- Illinois Adjustable Block Program (ABP) May 2025
- Illinois Solar for All (ILSFA) May 2025
- US EIA-860M (Utility scale projects) March 2025
New feature: hotlinks to places
You can now link directly to places in the IL Solar Map. Every time you click on a map feature, the URL will update. You can then share this link around to point people to specific locations. Here’s a few examples of geographies with the most energized solar in Illinois:
- Tract 17167003400 (593,136 kW, location of the Double Black Diamond Solar Farm)
- City of Chicago (58,240 kW)
- Sangamon County (606,678 kW)
- House District 108 (660,259 kW)
- Senate District 54 (680,891 kW)
While we’re at it, here are the places with the least amount of energized solar in Illinois:
- Alexander County (53 kW)
- House District 12 (118 kW)
- Senate District 3 (1,047 kW)
I won’t list them here, but there are 1,050 Census designated places (cities, villages, etc) and 487 tracts that have 0 kW of solar energized.
New map bucket sizes
Since we launched this project two years ago, over 3 gigawatts of solar have come online in the State of Illinois. To continue to make the maps easy to read, we have updated the numbers we are shading the map by to account for the larger numbers.
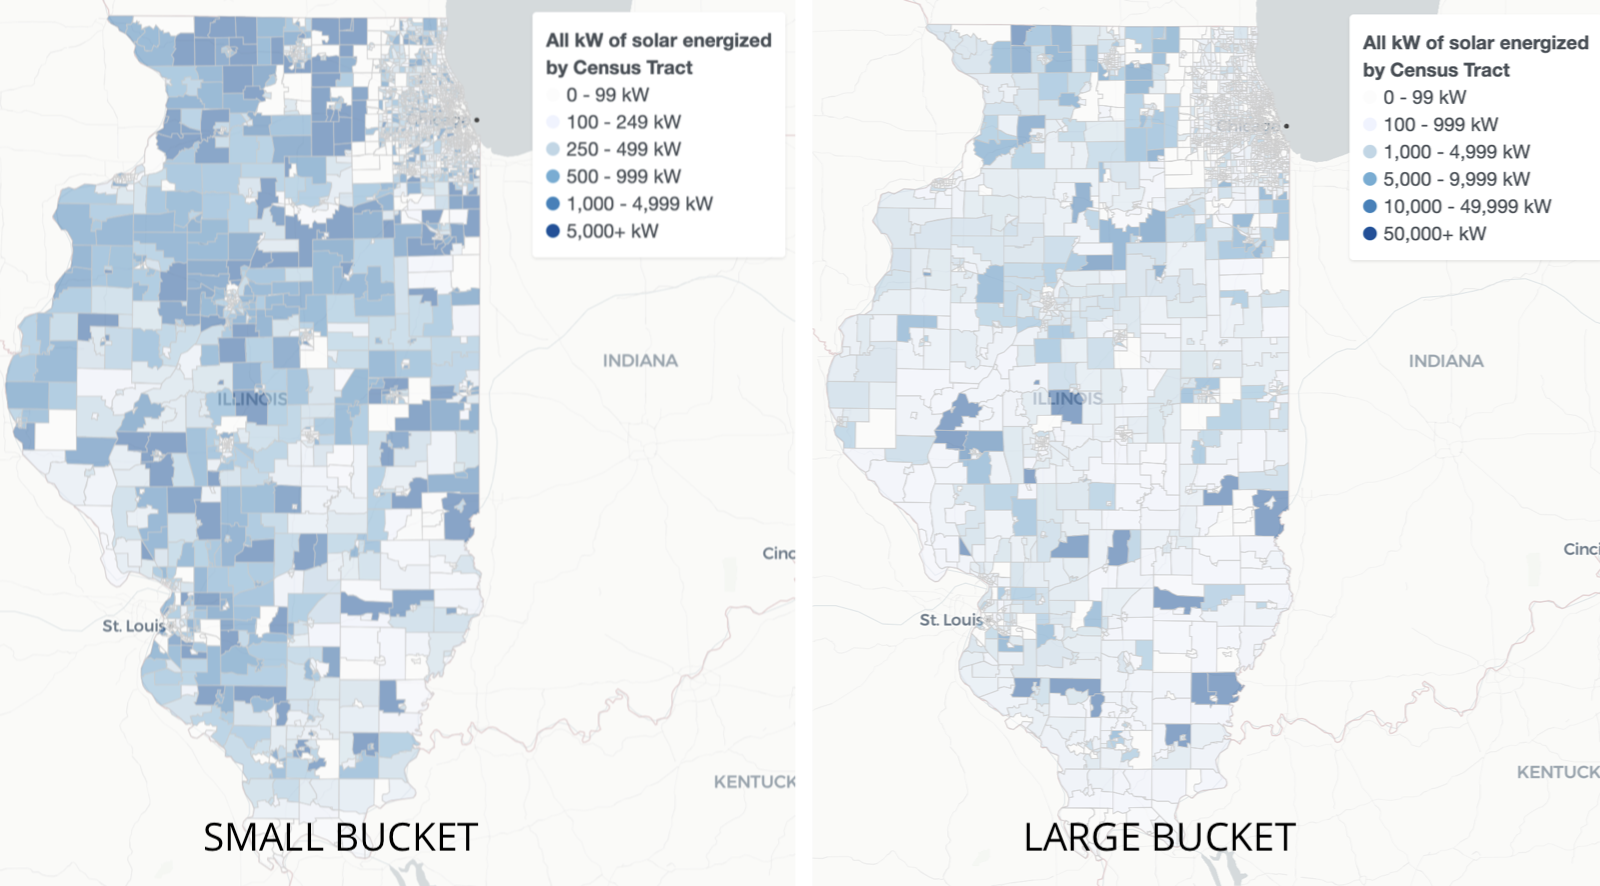
New bucket sizes for the IL Solar Map
Note the differences between these two maps. They are showing the same data, but the map on the right is shaded with higher numbers. Without doing this, eventually the gradual increase in solar projects would make these maps all one color!